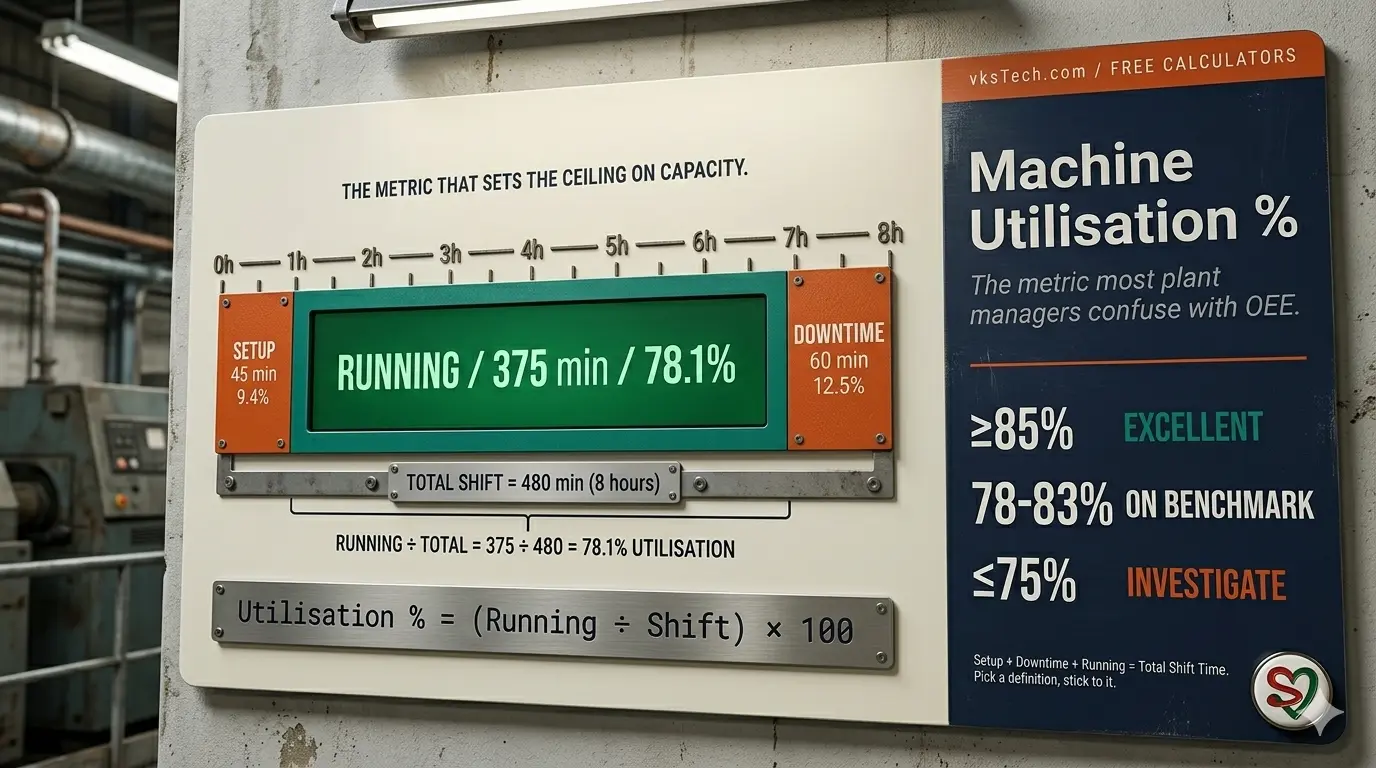
🏭 Machine Utilisation % Calculator — The Metric Most Plant Managers Confuse with OEE
📖 9-min read | The Running-Time Number That Sets the Ceiling on Everything Else | Published May 2026 | Metalliser-focused
A metalliser shift is 8 hours, 480 minutes. The operator logs 30 minutes of setup, 60 minutes of unplanned downtime (boat-change overrun, vacuum trip, cooling water issue). Running time: 480 − 30 − 60 = 390 minutes. Utilisation: 390 ÷ 480 = 81.3%. That single number — running time as a fraction of total shift time — sets the ceiling on everything else the machine can produce. Increase utilisation by 5 points and capacity goes up by 5 points. Lose 5 points to a recurring electrical issue and capacity drops by 5 points. Yet most metalliser operators cannot explain the difference between utilisation and OEE, and most plant managers track utilisation in ways that hide the real losses. This blog explains the formula behind the free Machine Utilisation % calculator on vkstech.com — what it computes, the six real situations metalliser supervisors use it for, and why the definitional choices matter more than the math.
📐 What Utilisation Measures (and What It Doesn't)
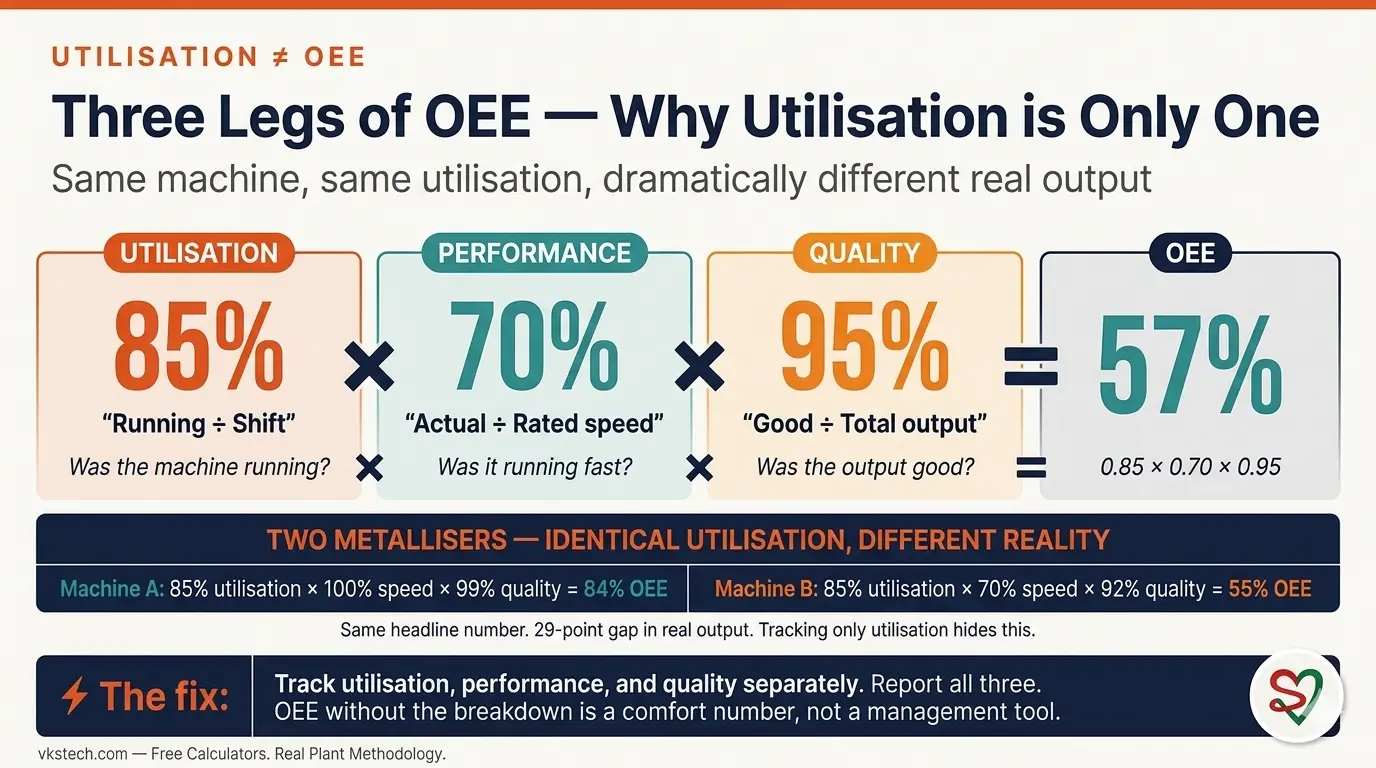
Utilisation answers exactly one question: of the total time the machine was scheduled to run, what fraction was it actually running? It does not answer how fast it was running, whether the output was good, or whether the planned production target was met. It is the time-based component of equipment effectiveness, not the whole story. The Overall Equipment Effectiveness (OEE) metric multiplies utilisation by performance (actual speed ÷ rated speed) and quality (good output ÷ total output) to give a single number. Utilisation is one of those three legs.
This matters because two metallisers can have identical utilisation and very different productivity. Machine A runs 85% of the time at 100% of rated speed with 99% quality — OEE = 84%. Machine B runs 85% of the time at 70% of rated speed with 92% quality — OEE = 55%. Same utilisation, dramatically different real output. A plant manager who tracks only utilisation thinks both machines are equally well run. A plant manager who tracks utilisation, performance, and quality separately can identify exactly where Machine B is losing.
That said, utilisation is the easiest of the three to measure (clock running vs not running, simple stopwatch logic), the most directly actionable (every minute of downtime has a clear cause), and the foundation of capacity planning (covered in Blog #30). Start with utilisation. Layer on performance and quality once utilisation is being measured consistently.
🛠️ The Six Real Situations Metalliser Supervisors Use This For
1. Daily shift report. The base case. Every shift logs setup, downtime, and running. Utilisation is the headline number on the shift report. Trended week over week, it shows whether the team's discipline is improving or slipping. Most metalliser department reviews start with the utilisation chart.
2. Downtime root-cause investigation. Utilisation drops 6 points week-over-week. The drop must be explainable — vacuum pump degradation, cooling water issue, operator changeover, electrical trip. Tracking utilisation forces the team to categorise downtime, which forces the root cause to surface. The number is the trigger; the categorisation is the value.
3. Boat-change SMED tracking. Boat-change duration is one of the largest single contributors to setup time. Reducing boat-change from 30 minutes to 15 minutes raises utilisation by ~3 percentage points on a 12-hour shift (covered in Blog #22). The utilisation number quantifies the SMED win in capacity terms.
4. Capacity planning. The capacity calculator (Blog #30) takes utilisation as a key input. If actual utilisation is 80% but the capacity model assumes 90%, the plant chronically under-delivers against plan. Tracking actual utilisation feeds the model with realistic numbers.
5. Maintenance scheduling. Planned PM (preventive maintenance) is downtime, but it is "good" downtime — it prevents larger unplanned losses. Tracking utilisation by category (planned PM vs unplanned breakdown vs operator-cause) reveals whether the PM schedule is right-sized. Too much PM crushes utilisation; too little PM creates breakdown spikes.
6. Inter-shift comparison. Day shift utilisation 87%, night shift utilisation 79%. The 8-point gap is unlikely to be machine-related (same equipment) — it is operator skill, supervisor presence, or attention level differences. The number identifies the gap; investigation finds the cause.
🧮 Machine Utilisation % Calculator (Embedded)
The calculator below takes shift duration, setup time, and downtime in minutes and returns running time and utilisation percentage. For shareable links and other related tools, use the full version on vkstech.com.
📊 Quick-Look Reference — Typical Metalliser Shift Scenarios
The table below shows typical utilisation outcomes for common metalliser shift patterns. Bookmark for shift-end review meetings.
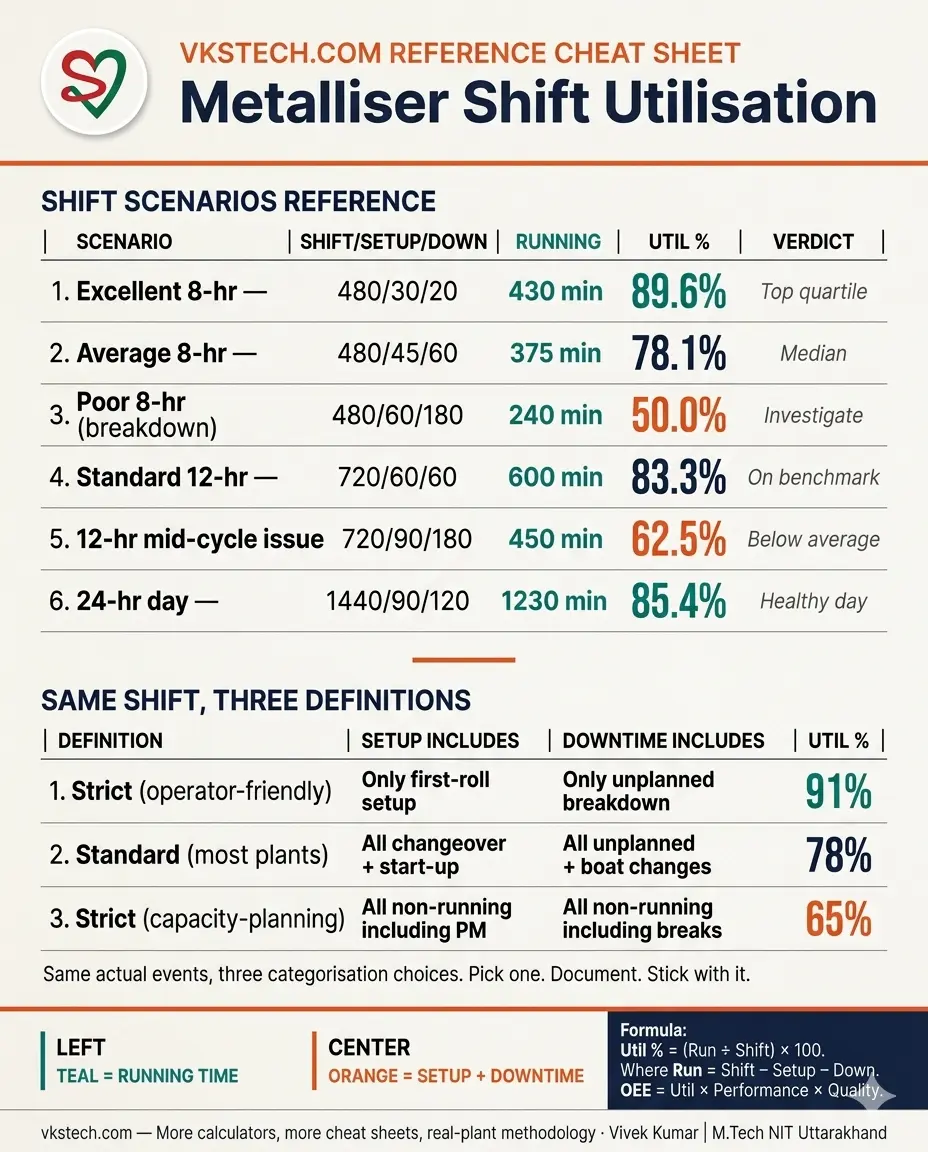
| Shift scenario | Shift | Setup | Downtime | Running | Utilisation | Verdict |
|---|---|---|---|---|---|---|
| Excellent 8-hr shift | 480 min | 30 min | 20 min | 430 min | 89.6% | Top quartile |
| Average 8-hr shift | 480 min | 45 min | 60 min | 375 min | 78.1% | Median |
| Poor 8-hr shift (breakdown) | 480 min | 60 min | 180 min | 240 min | 50.0% | Investigate |
| Standard 12-hr shift | 720 min | 60 min | 60 min | 600 min | 83.3% | On benchmark |
| 12-hr with mid-cycle issue | 720 min | 90 min | 180 min | 450 min | 62.5% | Below average |
| 24-hr day reference | 1440 min | 90 min | 120 min | 1230 min | 85.4% | Healthy day |
The 8-hour and 12-hour shifts behave differently because the proportional impact of fixed setup time changes. A 30-minute setup is 6.3% of an 8-hour shift but only 4.2% of a 12-hour shift. Plants on 12-hour shifts therefore look "more utilised" in headline numbers even when actual machine performance is the same. Always compare like-for-like shift durations when benchmarking.
🔄 Bonus — Three Definitions of Setup, Downtime, and Their Effect on Utilisation
The same shift can produce three different utilisation numbers depending on how setup and downtime are defined. The choice changes everything.
Three definitions, three answers, one underlying shift:
| Definition | Setup includes | Downtime includes | Sample utilisation* |
|---|---|---|---|
| Strict (operator-friendly) | Only first-roll setup | Only unplanned breakdown | 91% |
| Standard (most plants) | All changeover + start-up | All unplanned + boat changes | 78% |
| Strict (capacity-planning) | All non-running time including PM | All non-running time including breaks | 65% |
*Same 8-hour shift with same actual events, just categorised differently. The "right" definition is the one your plant uses consistently across shifts and across time. Inconsistency is the real enemy.
Most plants converge on the "Standard" definition because it gives a number high enough to be motivating but low enough to spotlight real problems. The strictest definition is honest but demoralising. The loosest definition flatters everyone and identifies nothing. Pick one, document it, and stick with it for at least a year before considering a change.
⚠️ Three Common Mistakes
1. Confusing utilisation with OEE. Utilisation is the time component only. OEE multiplies utilisation by performance and quality. A metalliser running at 90% utilisation but 70% of rated speed and 95% quality has OEE = 0.90 × 0.70 × 0.95 = 60%. Reporting "90% utilisation" without the other two factors hides the real machine effectiveness. Always state which metric you mean.
2. Including planned PM in downtime without flagging it. Planned preventive maintenance is downtime in the formula, but it is "good" downtime. A shift with 60 minutes of scheduled PM has lower utilisation than a shift without PM, even though the PM prevents larger unplanned losses. Most plants either (a) report utilisation excluding PM or (b) report it including PM but flag the PM portion. Never silently include or exclude — make the choice visible.
3. Averaging utilisation across shifts hides individual problems. Plant-week average 82% looks fine. But that masks Day Shift = 87%, Night Shift = 79%, Maintenance Shift = 75%. The 12-point spread across shifts is the actionable insight. Always report by shift, then average. The average alone is a comfort number, not a management tool.
📚 Related reads on this site: This blog explains the Machine Utilisation % calculator. Blog #30 covers the Metalliser Capacity calculator that takes utilisation as a key input. Blog #22 and Blog #23 cover SMED case studies that directly improve utilisation by reducing setup/changeover. Blog #25 is the SMED hub. The full set of free calculators is at vkstech.com/#calculators.
Disagree with how planned PM should be classified? Working in a plant where utilisation definitions are inconsistent across shifts? Want to discuss how to roll out OEE on top of utilisation? Drop your question in the Q&A section at the bottom of this page — I respond personally to every thoughtful question.
📌 What's next. The calculator-explainer series continues — next up is the Roll Length from Weight calculator, or the Met M/C Capacity calculator deep-dive (which builds on this one). Tell me which you want next.
🏭 Machine Utilisation % Calculator — वो Metric जिसे ज़्यादातर Plant Managers OEE से Confuse करते हैं
📖 9-min read | Running-Time Number जो बाक़ी सब के लिए Ceiling Set करता है | May 2026 में published | Metalliser-focused
एक metalliser shift 8 hours, 480 minutes का है। Operator 30 minutes setup, 60 minutes unplanned downtime (boat-change overrun, vacuum trip, cooling water issue) log करता है। Running time: 480 − 30 − 60 = 390 minutes। Utilisation: 390 ÷ 480 = 81.3%। वो single number — running time as fraction of total shift time — machine जो भी produce कर सकती है उस पर ceiling set करता है। Utilisation 5 points से बढ़ाएँ और capacity 5 points से जाती है। Recurring electrical issue पर 5 points lose करें और capacity 5 points से drop होती है। फिर भी ज़्यादातर metalliser operators utilisation और OEE के बीच का difference explain नहीं कर सकते, और ज़्यादातर plant managers utilisation को इस तरह track करते हैं जो real losses छिपाता है। ये blog उस formula को explain करता है जो vkstech.com पर free Machine Utilisation % calculator के पीछे है — क्या compute करता है, छह real situations जहाँ metalliser supervisors use करते हैं, और क्यों definitional choices math से ज़्यादा matter करती हैं।
📐 Utilisation क्या Measure करता है (और क्या नहीं)
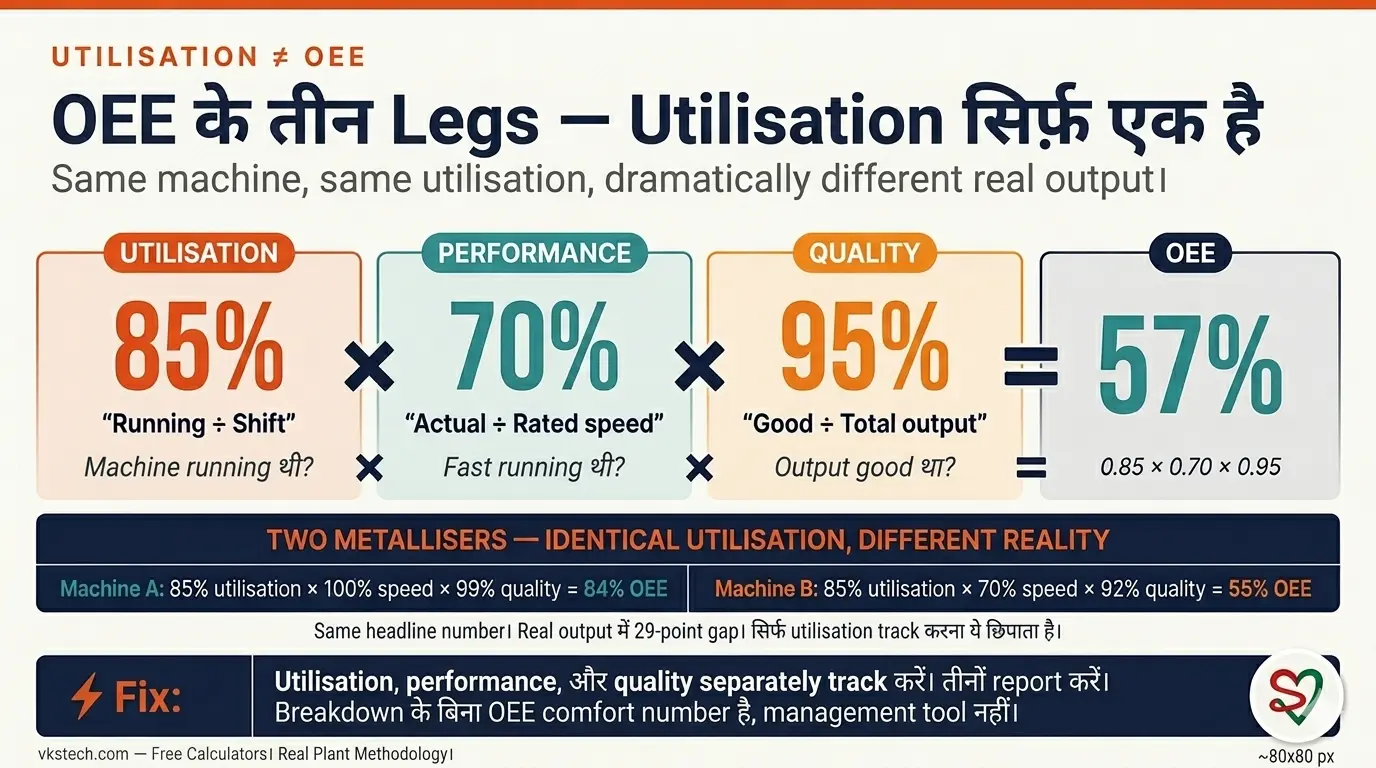
Utilisation exactly एक question का answer देता है: total time जो machine scheduled थी run होने को, उसका कितना fraction actually running था? ये नहीं answer करता कि कितनी fast running थी, output good था या नहीं, या planned production target met था। ये equipment effectiveness का time-based component है, whole story नहीं। Overall Equipment Effectiveness (OEE) metric utilisation को performance (actual speed ÷ rated speed) और quality (good output ÷ total output) से multiply करता है single number देने के लिए। Utilisation उन तीन legs में से एक है।
ये matter करता है क्योंकि दो metallisers का identical utilisation और very different productivity हो सकती है। Machine A 85% time पर 100% rated speed पर 99% quality के साथ run करती है — OEE = 84%। Machine B 85% time पर 70% rated speed पर 92% quality के साथ run करती है — OEE = 55%। Same utilisation, dramatically different real output। एक plant manager जो सिर्फ़ utilisation track करता है सोचता है दोनों machines equally well run हैं। एक plant manager जो utilisation, performance, और quality separately track करता है exactly identify कर सकता है कहाँ Machine B losing है।
उससे कहा, utilisation तीनों में से सबसे easy है measure करना (clock running vs not running, simple stopwatch logic), सबसे directly actionable (हर minute downtime का clear cause है), और capacity planning का foundation है (Blog #30 में cover)। Utilisation से start करें। Utilisation को consistently measure होने के बाद performance और quality layer करें।
🛠️ छह Real Situations जहाँ Metalliser Supervisors इसे Use करते हैं
1. Daily shift report। Base case। हर shift setup, downtime, और running log करती है। Shift report पर utilisation headline number है। Week over week trended, ये दिखाता है team की discipline improve हो रही है या slip। ज़्यादातर metalliser department reviews utilisation chart से start होती हैं।
2. Downtime root-cause investigation। Utilisation week-over-week 6 points drop होता है। Drop को explainable होना चाहिए — vacuum pump degradation, cooling water issue, operator changeover, electrical trip। Utilisation track करना team को downtime categorise करने पर force करता है, जो root cause को surface करने पर force करता है। Number trigger है; categorisation value है।
3. Boat-change SMED tracking। Boat-change duration setup time के सबसे बड़े single contributors में से एक है। Boat-change को 30 minutes से 15 minutes reduce करना 12-hour shift पर utilisation को ~3 percentage points से raise करता है (Blog #22 में cover)। Utilisation number SMED win को capacity terms में quantify करता है।
4. Capacity planning। Capacity calculator (Blog #30) utilisation को key input के रूप में लेता है। अगर actual utilisation 80% है पर capacity model 90% assume करता है, plant chronically plan के against under-deliver करता है। Actual utilisation track करना model को realistic numbers feed करता है।
5. Maintenance scheduling। Planned PM (preventive maintenance) downtime है, पर "good" downtime है — ये बड़े unplanned losses prevent करता है। Utilisation को category से track करना (planned PM vs unplanned breakdown vs operator-cause) reveal करता है कि PM schedule right-sized है। बहुत ज़्यादा PM utilisation crush करता है; बहुत कम PM breakdown spikes create करता है।
6. Inter-shift comparison। Day shift utilisation 87%, night shift utilisation 79%। 8-point gap likely नहीं machine-related (same equipment) — operator skill, supervisor presence, या attention level differences हैं। Number gap identify करता है; investigation cause find करती है।
🧮 Machine Utilisation % Calculator (Embedded)
नीचे calculator shift duration, setup time, और downtime minutes में लेता है और running time और utilisation percentage return करता है। Shareable links और दूसरे related tools के लिए, vkstech.com पर full version use करें।
📊 Quick-Look Reference — Typical Metalliser Shift Scenarios
नीचे की table common metalliser shift patterns के लिए typical utilisation outcomes दिखाती है। Shift-end review meetings के लिए bookmark करें।
| Shift scenario | Shift | Setup | Downtime | Running | Utilisation | Verdict |
|---|---|---|---|---|---|---|
| Excellent 8-hr shift | 480 min | 30 min | 20 min | 430 min | 89.6% | Top quartile |
| Average 8-hr shift | 480 min | 45 min | 60 min | 375 min | 78.1% | Median |
| Poor 8-hr shift (breakdown) | 480 min | 60 min | 180 min | 240 min | 50.0% | Investigate |
| Standard 12-hr shift | 720 min | 60 min | 60 min | 600 min | 83.3% | On benchmark |
| 12-hr with mid-cycle issue | 720 min | 90 min | 180 min | 450 min | 62.5% | Below average |
| 24-hr day reference | 1440 min | 90 min | 120 min | 1230 min | 85.4% | Healthy day |
8-hour और 12-hour shifts differently behave करते हैं क्योंकि fixed setup time का proportional impact change होता है। 30-minute setup 8-hour shift का 6.3% है पर 12-hour shift का सिर्फ़ 4.2%। 12-hour shifts वाले plants therefore headline numbers में "more utilised" लगते हैं even जब actual machine performance same है। Benchmarking करते हुए हमेशा like-for-like shift durations compare करें।
🔄 Bonus — Setup, Downtime के तीन Definitions और उनका Utilisation पर Effect
Same shift तीन different utilisation numbers produce कर सकती है depending पर setup और downtime कैसे defined हैं। Choice सब कुछ change करती है।
तीन definitions, तीन answers, एक underlying shift:
| Definition | Setup includes | Downtime includes | Sample utilisation* |
|---|---|---|---|
| Strict (operator-friendly) | Only first-roll setup | Only unplanned breakdown | 91% |
| Standard (most plants) | All changeover + start-up | All unplanned + boat changes | 78% |
| Strict (capacity-planning) | All non-running time including PM | All non-running time including breaks | 65% |
*Same 8-hour shift with same actual events, सिर्फ़ differently categorised। "Right" definition वो है जो आपका plant shifts across और time across consistently use करता है। Inconsistency real enemy है।
ज़्यादातर plants "Standard" definition पर converge होते हैं क्योंकि ये number high enough देता है motivating होने के लिए पर low enough real problems spotlight करने के लिए। Strictest definition honest है पर demoralising। Loosest definition सबको flatter करती है और कुछ identify नहीं करती। एक pick करें, document करें, और कम से कम एक year के लिए change consider करने से पहले उसी पर stick रहें।
⚠️ तीन Common Mistakes
1. Utilisation को OEE से confuse करना। Utilisation सिर्फ़ time component है। OEE utilisation को performance और quality से multiply करता है। 90% utilisation पर पर 70% rated speed और 95% quality पर running metalliser का OEE = 0.90 × 0.70 × 0.95 = 60% है। बाक़ी दो factors के बिना "90% utilisation" report करना real machine effectiveness छिपाता है। हमेशा state करें कौन सा metric mean कर रहे हैं।
2. Planned PM को flag किए बिना downtime में include करना। Planned preventive maintenance formula में downtime है, पर "good" downtime है। 60 minutes scheduled PM वाली shift का utilisation PM के बिना shift से कम है, even though PM बड़े unplanned losses prevent करता है। ज़्यादातर plants या तो (a) PM excluding utilisation report करते हैं या (b) PM including report करते हैं पर PM portion flag करते हैं। कभी silently include या exclude नहीं — choice visible बनाएँ।
3. Shifts across utilisation average करना individual problems छिपाता है। Plant-week average 82% fine लगती है। पर वो mask करता है Day Shift = 87%, Night Shift = 79%, Maintenance Shift = 75%। Shifts across 12-point spread actionable insight है। हमेशा shift से report करें, फिर average। Average अकेला comfort number है, management tool नहीं।
📚 इस site पर related reads: ये blog Machine Utilisation % calculator explain करता है। Blog #30 Metalliser Capacity calculator cover करता है जो utilisation को key input के रूप में लेता है। Blog #22 और Blog #23 SMED case studies cover करते हैं जो directly setup/changeover reduce करके utilisation improve करते हैं। Blog #25 SMED hub है। Free calculators का full set vkstech.com/#calculators पर है।
Planned PM कैसे classify होनी चाहिए से disagree करते हैं? ऐसे plant में काम कर रहे हैं जहाँ utilisation definitions shifts across inconsistent हैं? Discuss करना चाहते हैं utilisation के top पर OEE कैसे roll out करें? अपना सवाल इस page के bottom पर Q&A section में डालें — मैं हर thoughtful question का personally जवाब देता हूँ।
📌 आगे क्या। Calculator-explainer series जारी है — अगला है Roll Length from Weight calculator, या Met M/C Capacity calculator deep-dive (जो इस पर build करता है)। बताएँ कौन सा next चाहिए।